Vibe-coding is a new term that means using AI to generate code, based on just instructions in normal human language (no actual programming language knowledge required). As AI coding tools have improved, people have been able to write complete apps without any experience in coding!
For myself, an experienced coder, I find vibe coding really useful and fun when I want to do one-off coding, such as interactive tools for exploring data. In this blog post, I show how you can create an interactive and fun tool to visualize and analyze your activity data in the Time Atlas app.
You can try the tool, which took me about 2 minutes for me to make, here. Below is a screenshot of the tool:
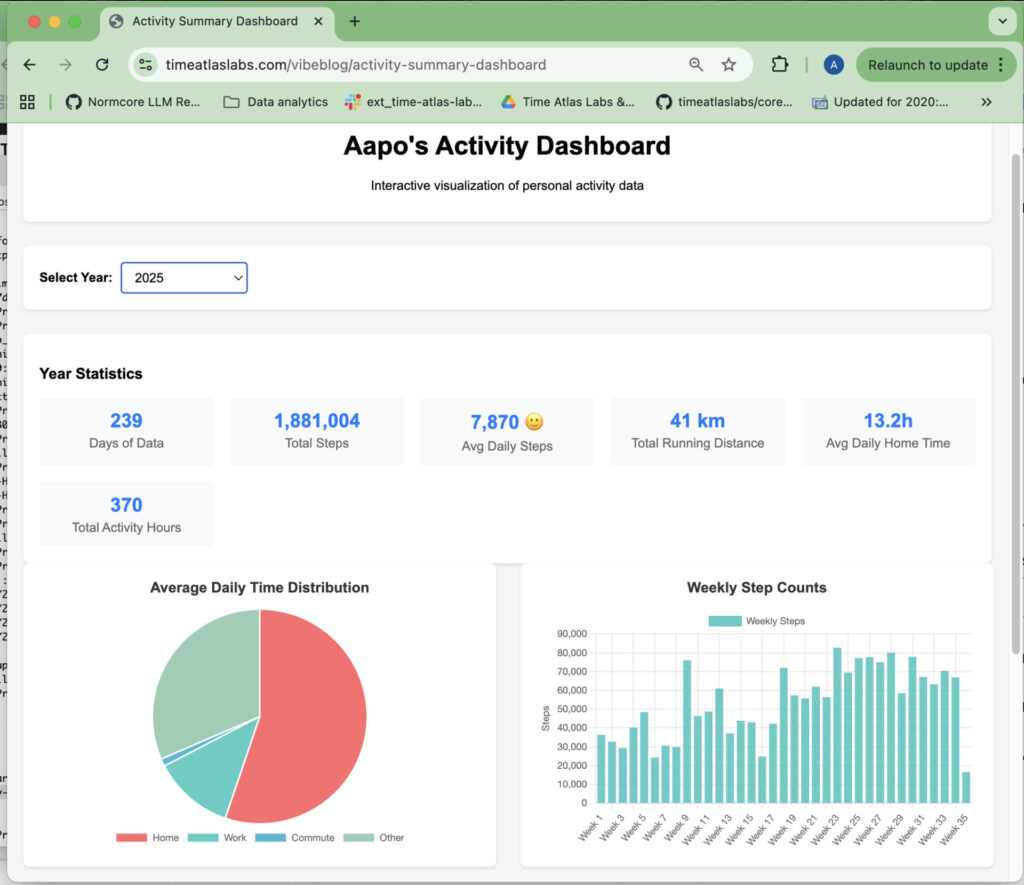
Here are instructions how to make such a tool. And the best thing about vibe coding is that you can customize the tool as you wish! For example, I added the emoji into the “Avg daily steps” box as a small tweak in the end.
Step 1: Export your data from Time Atlas
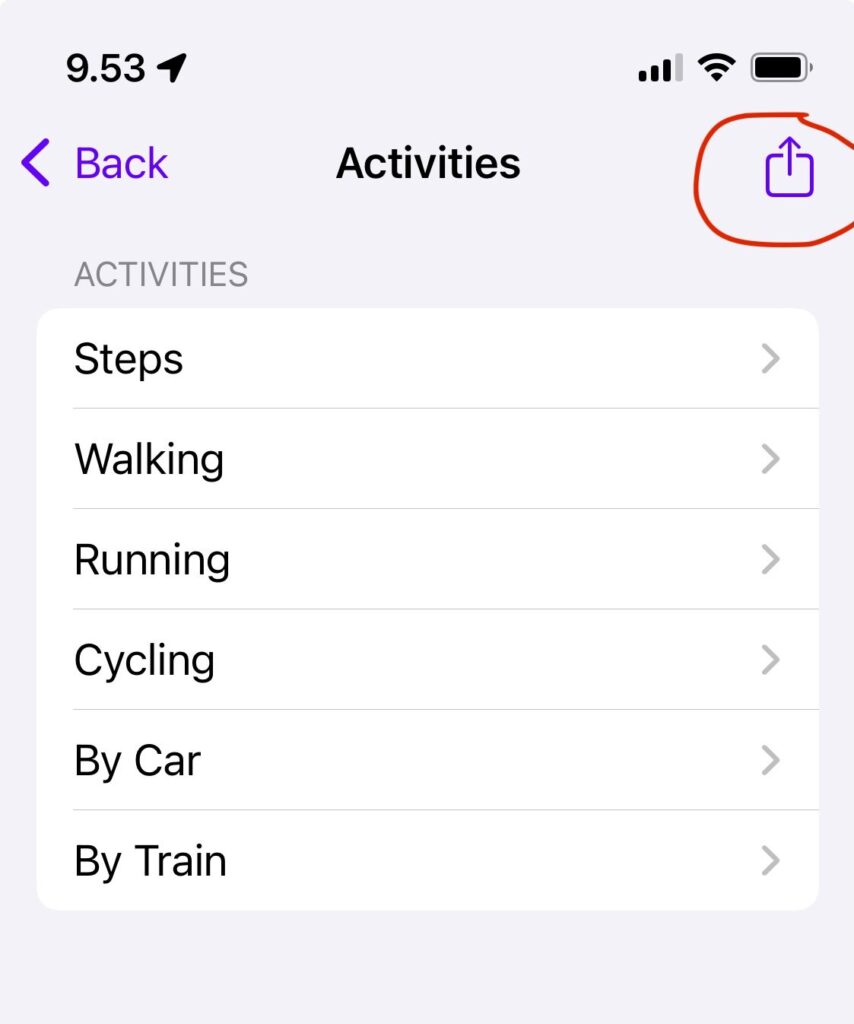
In the app, choose the Dashboard tab. Tap the “Activities” link and then tap the export-button on the top right corner, see picture below:
Export this file with AirDrop to your computer, or use some other way (such as Dropbox, or email) to transfer it to your computer.
Rename the file to “summaries.csv”.
Step 2: Vibe-code the Tool
I used Claude Code to create my tool, but there are many other options such as Cursor or OpenAI Codex, which probably will work as well. For non-technical users, you can even try ChatGPT or Claude website, but I have not personally tried it for this purpose.
Here is my initial prompt:
Create me a webpage with is an interactive tool to study my activity summaries The activity summaries are stored in file “summaries.csv”, use Javascript to load the data. Then add a selector for year (years 2014-2018, and 2024, 2025). When user selects a year, it will show statistics for the data on that year. Add following diagrams: pie chart to show average daily time at home, work and commute (out of total 86400 secs), Then another which shows a bar chart of weekly step counts. Third one which shows bar chart of physical activity time in hour, in weekly basis. And fourth diagram is the monthly running and bicycling distance.
This already worked well, but I found out that I cannot open the generated HTML file own my computer directly, as the browser does not allow loading the CSV file locally. To fix this, Claude started a webserver for me. You can also ask it to embed the CSV data into the HTML file itself, and avoid this problem.
Step 3: Customize the Tool Further
I further improved the tool with the following prompts:
Thanks! Change the loading code load only rows which have total steps > 0. Then add a title “Aapo’s Activity Dashboard”
This instructions was necessary as my data includes rows from the early development phase of the app, and is missing some data from those days.
Finally, for the Avg Daily Steps box, add an emoji that is smiling or frowny based on the number. 10,000 is smiley face, but 5000 would be a sad one.
About the Data
Time Atlas data exports may have over 40 columns (the exact number depends on your particular data). The app tries to infer the types of your activities, such as if you were commuting or going out in the evening. The quality of these inferences depends on the quality of the data in your Timeline, i.e whether you have kept your garden in a good condition. Most importantly, one should choose the places that they have visited (for example, a particular restaurant), and set their home and work (if applicable) places. This is easy by tapping a place visit on the timeline. Also, you can correct mistakenly recognized activities, and particularly choose for the “Transport” activities whether they are with Car, Train, Bus, etc.
The value of your data will increase over time, and I am excited to look at my data at the end of the year, my first full year with Time Atlas. I also have data imported from the Moves app (see my blog post), and it is exciting to be able to look at all that historical data again!
PS. if you wonder why I was so much home in 2024, it is because my family welcomed baby twin boys!